


Senmos for iBridge
The monitoring platform with a built-in iBridge integration
Senmos connects to the iBridge portal out of the box — stream strain, temperature and acceleration from your iBridge dataloggers straight into real-time dashboards, alarms and reports. From €29/month, no binding period.

iBridge data, connected directly
It is a compact, smart datalogger with built-in Wheatstone-bridge electronics for strain gauges, plus internal temperature and accelerometer, streaming over 4G to the portal. Because Senmos integrates that portal’s API, your readings flow in automatically and sit alongside every other sensor brand on one platform, with the dashboards, alarms and reports your team and clients need.
Works with your iBridge hardware
Connect your sensors and data loggers — Senmos reads them all.
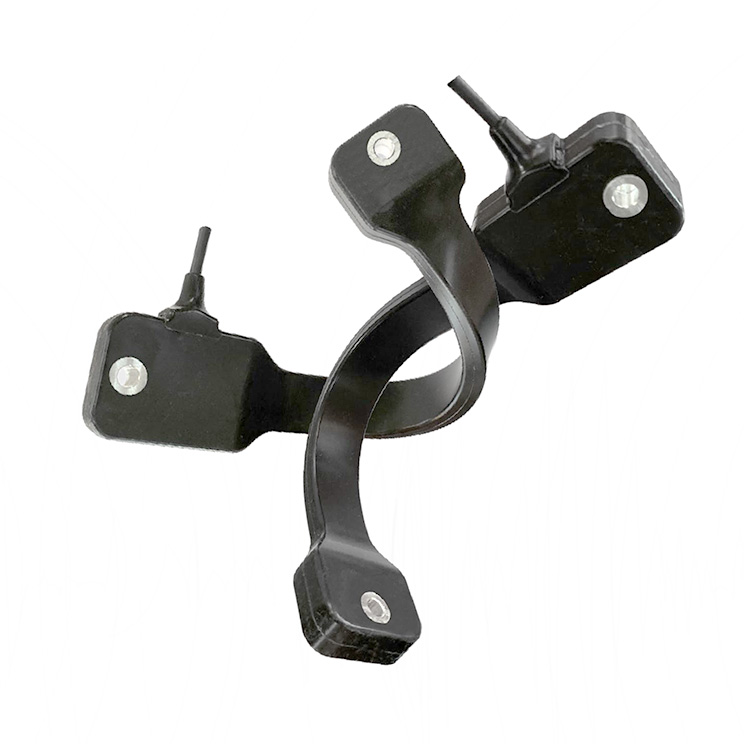
Compact Datalogger
A 4G logger sampling strain, acceleration and temperature on the structure.
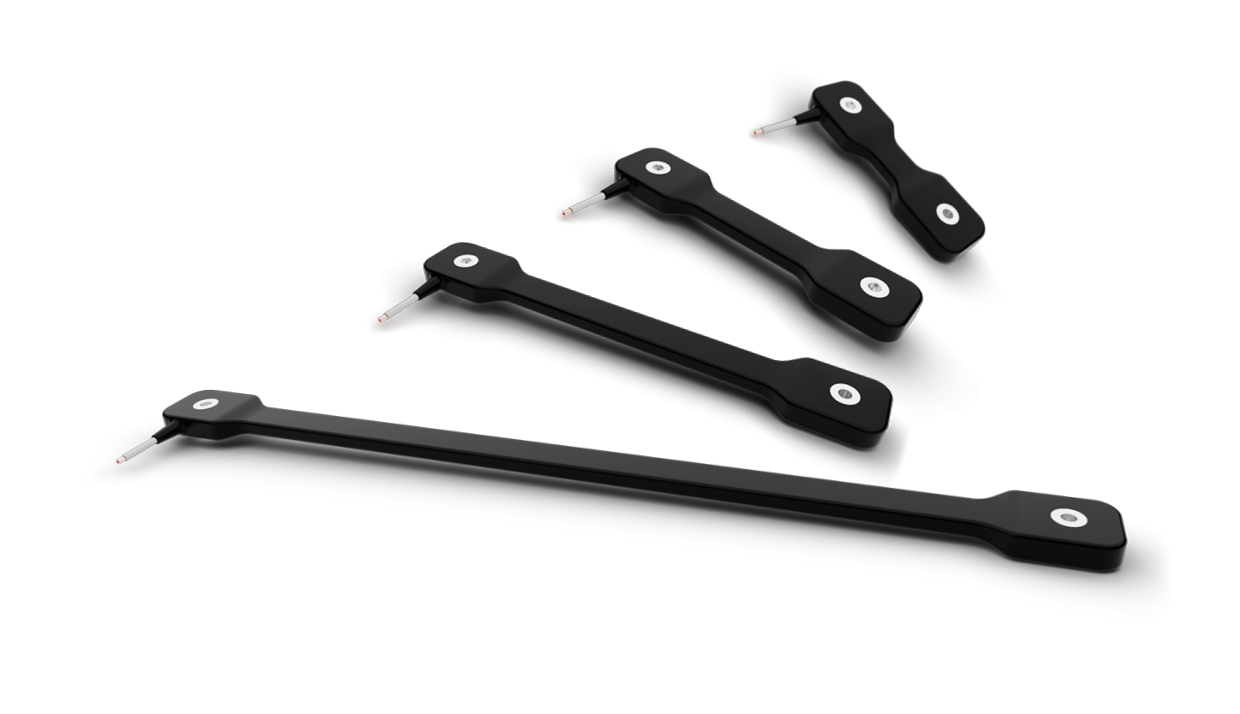
Connected Sensors
Strain gauges and accelerometers wired in — every channel lands on your Senmos dashboards.
How your data reaches Senmos
From sensor to live dashboard in three steps — usually minutes, not weeks.
Your data logger measures
Strain gauges, accelerometer and temperature are sampled on site and transmitted over 4G to the portal.
Senmos pulls it via the portal API
Senmos integrates the portal API directly — your dataloggers appear in Senmos with no manual files to move.
Visualise, alarm & report
Strain, acceleration and temperature appear on live dashboards and maps, with threshold alarms and scheduled reports.

Your iBridge data, live in Senmos
- Real-time line plots of every reading
- Threshold and rate-of-change alarms by e-mail and WhatsApp
- Interactive site maps with every sensor positioned
- Scheduled, client-ready PDF reports — no spreadsheet exports
- Your data alongside any other sensor brand, on one platform
What you get with Senmos
Everything you need to turn sensor readings into decisions.
Native integration
Connect the portal API directly inside Senmos — no exports, no middleware.
Real-time dashboards & maps
Live strain, acceleration and temperature on customisable dashboards and interactive site maps.
Alarms that reach people
Threshold and rate-of-change alarms by e-mail and WhatsApp the moment a limit is crossed.
Automated reports
Scheduled, client-ready reports turn raw data into documents — no spreadsheet exports.
Mix in any sensor
Combine it with piezometers, weather stations, total stations or any other brand on one platform.
Transparent pricing
From €29/month with an online calculator, so you can budget your project before you commit.
See your whole structure at a glance
From a single sensor to a full 3D model of your structure — every reading positioned in context, live, in one view.

Frequently asked questions
Does Senmos work with iBridge dataloggers?
Yes — directly. Senmos has a built-in integration that pulls data from the portal API, so strain, temperature and acceleration readings from dataloggers flow into Senmos dashboards, alarms and reports.
How do I connect data to Senmos?
Dataloggers transmit to the portal over 4G, and Senmos integrates that portal’s API directly — so your data appears in Senmos automatically, with no manual export.
What can it measure?
It is a compact datalogger with Wheatstone-bridge electronics for strain gauges plus internal temperature and accelerometer, capturing strain, acceleration, displacement, vibration and temperature — all visualised in Senmos.
What does a monitoring platform cost?
Senmos plans start at €29/month with no binding period, and an online price calculator lets you estimate the cost for your datalogger count up front.

Put your iBridge sensors on Senmos
See your own data live in Senmos. Start with the price calculator or book a personal walkthrough — no commitment, no binding period.