All your data in one place
- Collect sensor data from all your hardware in one place in Senmos
- Visualise and analyse your data in real time
- Instant alarms when limit values are exceeded
- Hardware-agnostic — integrated with 20+ suppliers

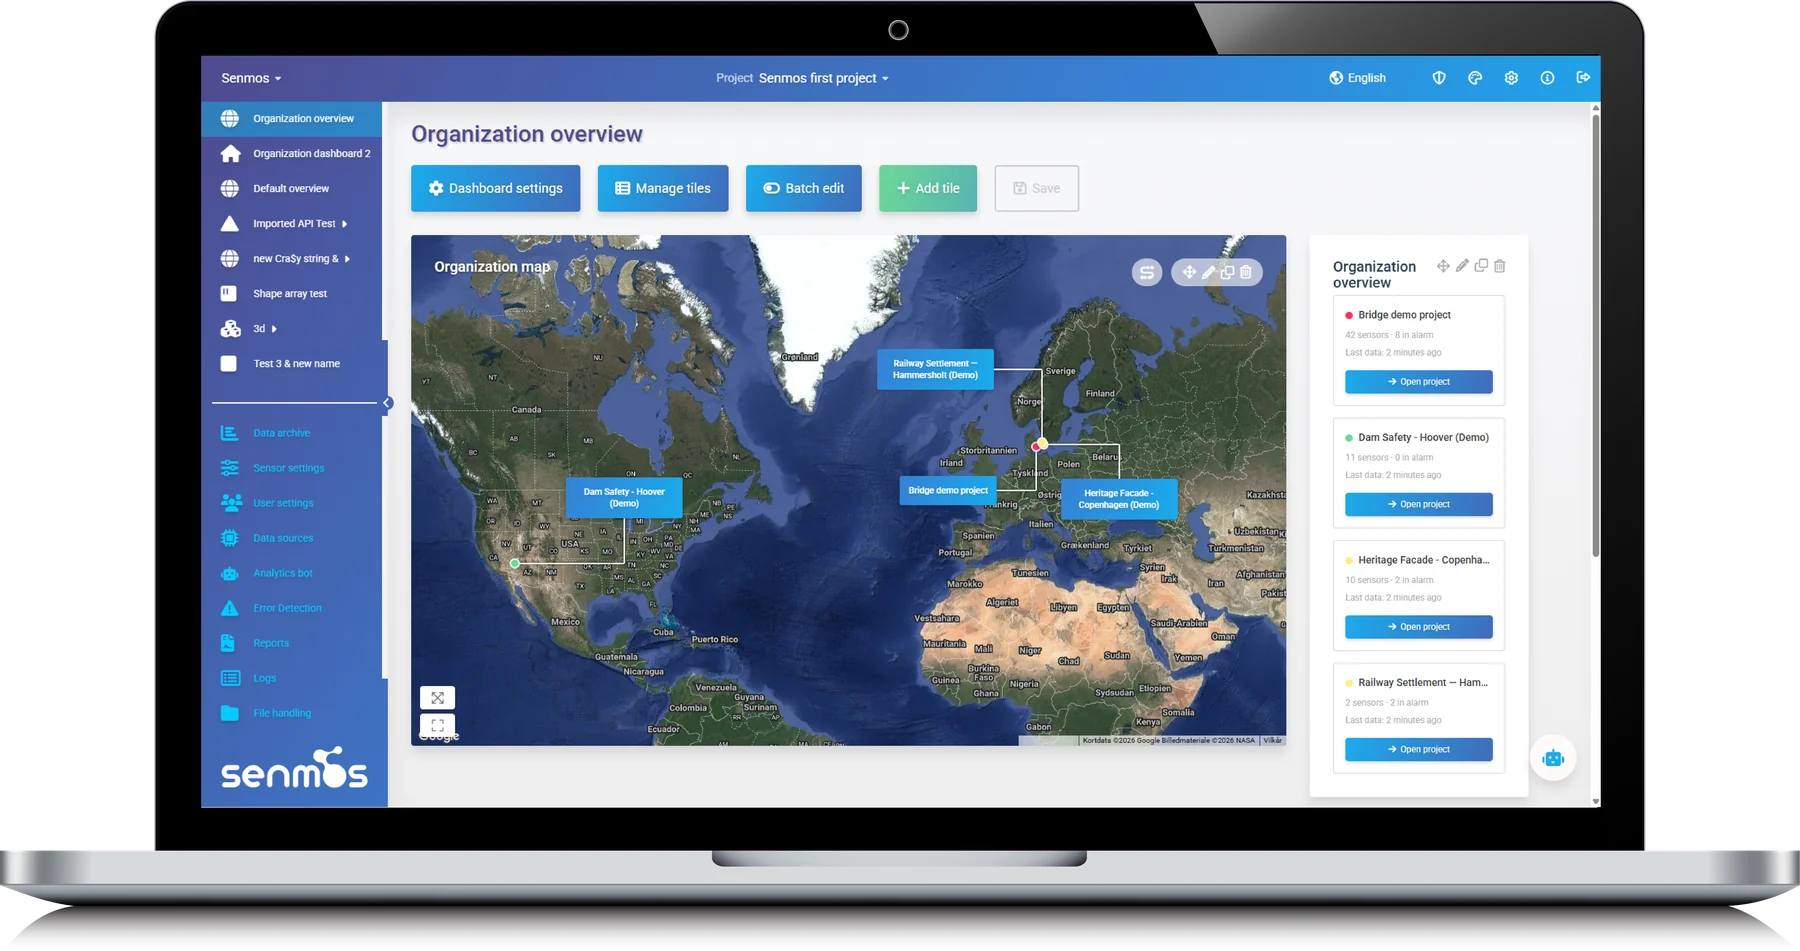
Analyse data from any source in one place with Senmos
Senmos is hardware-agnostic and already fully integrated with more than 20 hardware suppliers. Whoever supplied your sensors, all your data comes together in one platform.
















Let our AI agent keep an eye on your project
Senmos Watch is our AI agent. We set it up on your project and train it on your sensors and your alarm limits. It goes through your data around the clock, tells sensor faults from real changes, writes reports, and alerts you when something needs attention.
Gain valuable insight with advanced data analysis
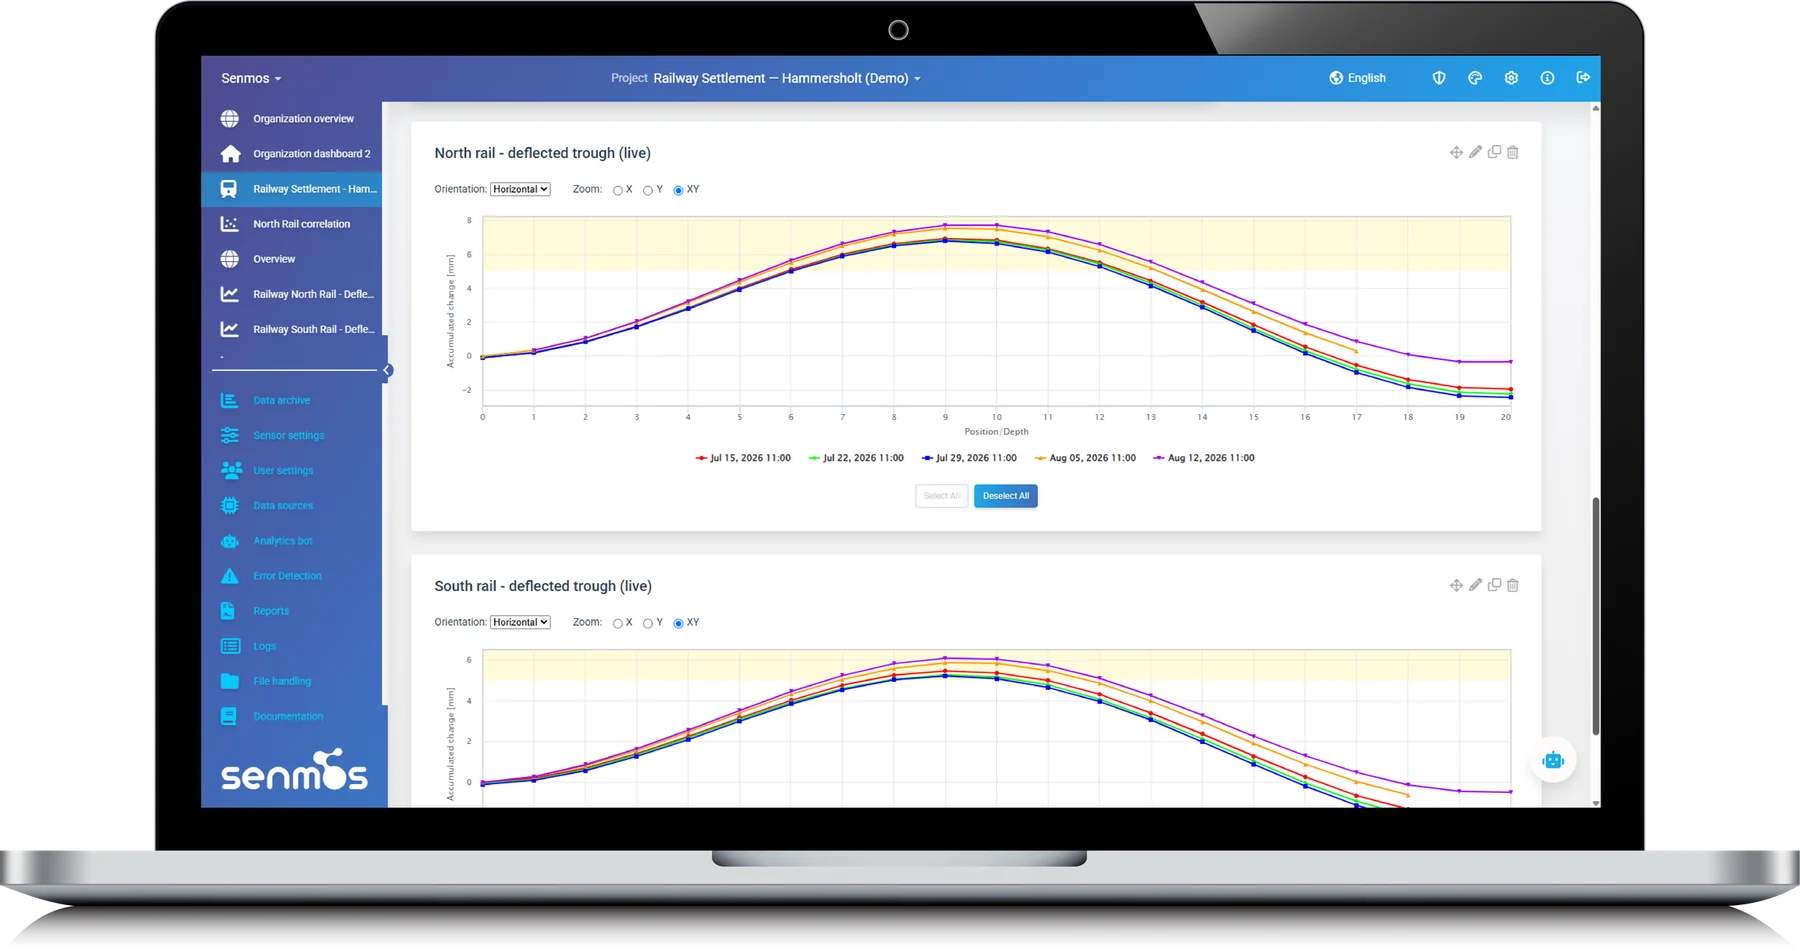
Senmos offers advanced data analysis tools for fatigue calculation, vibration visualisation and correlation analysis. Senmos integrates expertise from structural engineering, electrical engineering and computer science to deliver comprehensive structural health monitoring. Continuously updated with relevant tools, Senmos makes sure you get deeper insight and maximum value from your data.
Bring your data to life with dynamic visualisations
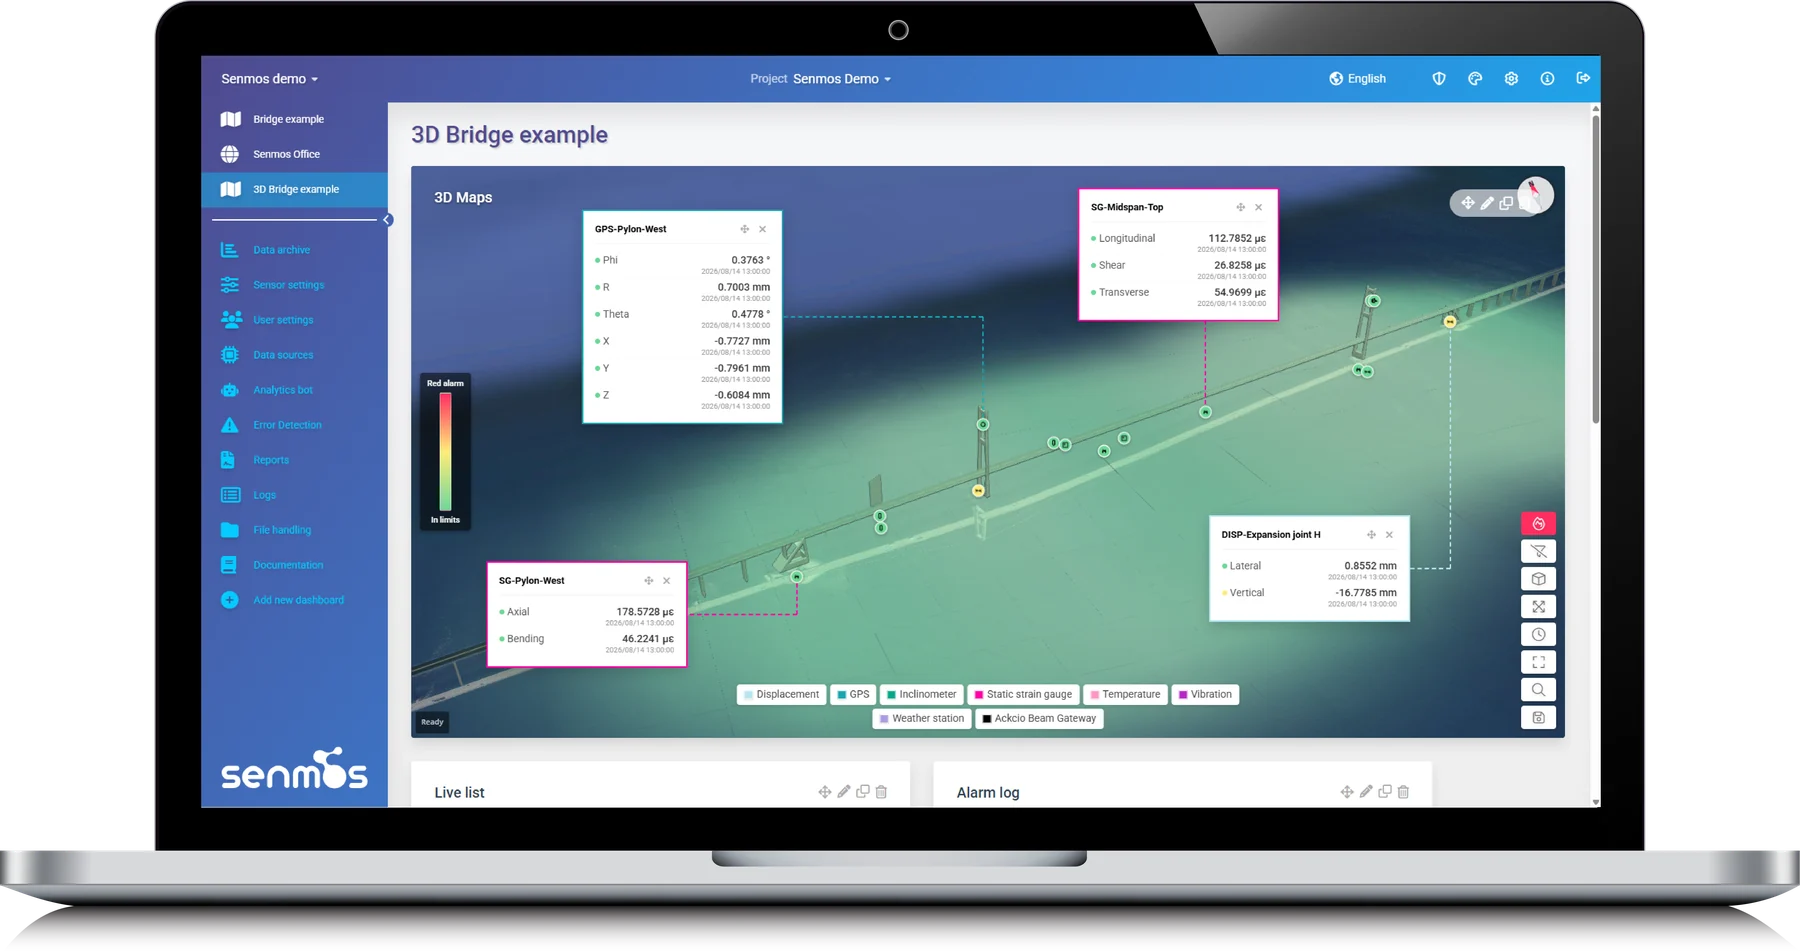
Visualise live values and alarms instantly on illustrations and images, giving you a quick read on the health of your structure. Senmos lets you combine graphs with text and images for a deeper understanding. Build your own dashboards that highlight the data points and trends that matter, so complex information becomes easy to understand and act on.
Peace of mind with instant alarms
Senmos makes sure you never miss a critical event, with instant alarms on every sensor. When a limit value is exceeded, you receive a detailed alarm with location, name and value. Log in to Senmos to look closer. Intuitive graphs highlight the limit values, so it is easy to see where your sensor values should be, and when they cross the line.
 +
+ 
From project management to monitoring with IoT PM
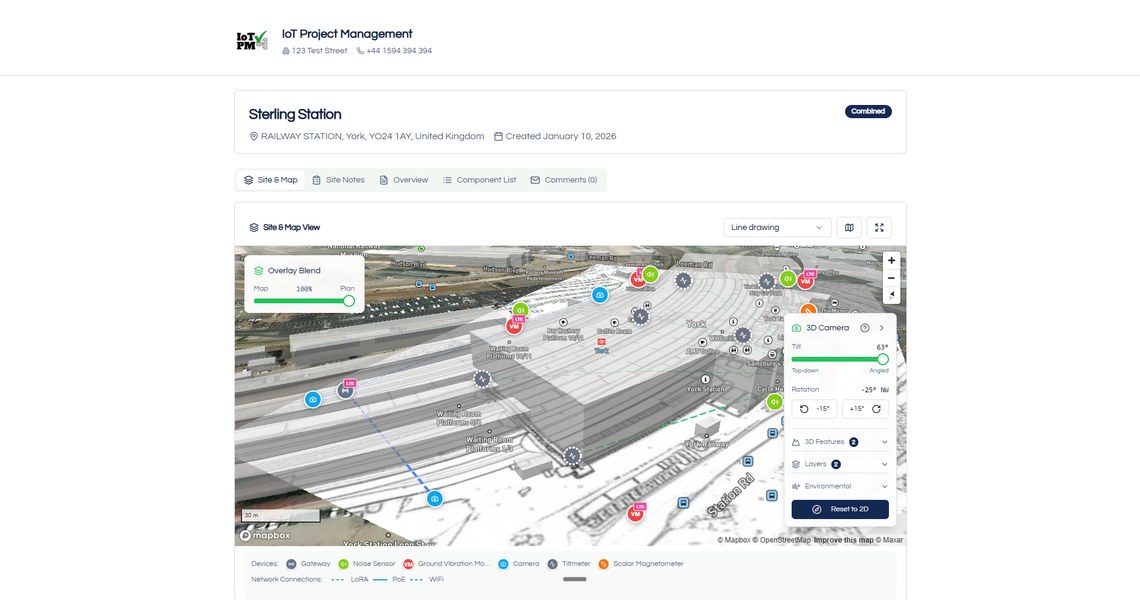
Working with IoT PM, you go from project setup to live monitoring in three simple steps. Data flows automatically from the project management system into Senmos — no manual export.
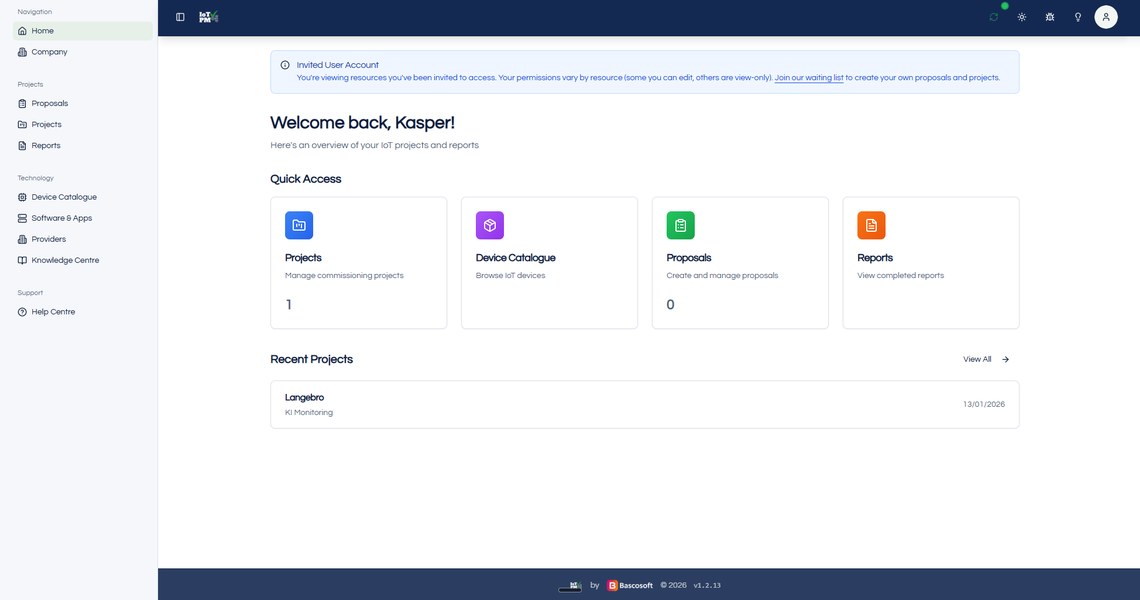
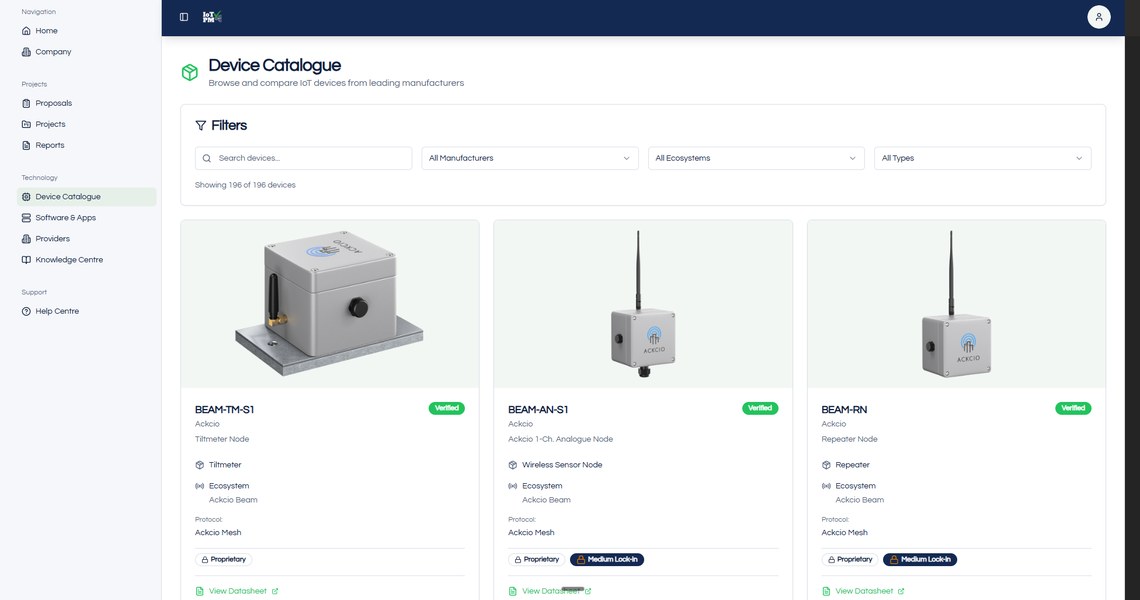
Create the project in IoT PM
Plan and run your monitoring project in IoT PM’s project management system — sensors, locations and tasks in one place.
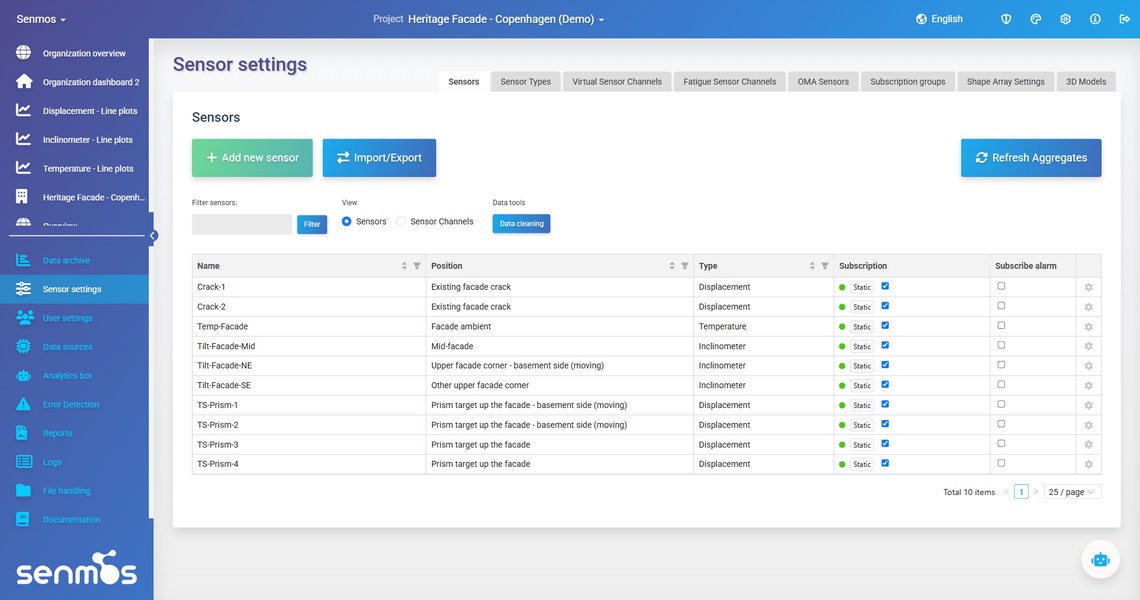
Data flows automatically
Sensor data is sent automatically from IoT PM to Senmos. No manual export, no double entry — the setup comes with it.
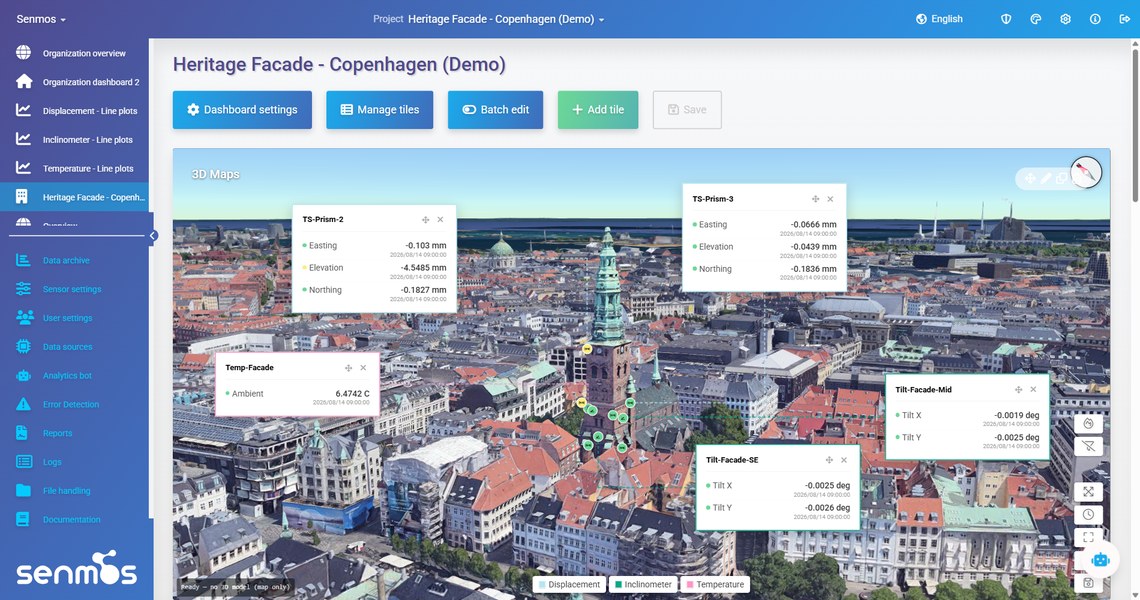
Live in Senmos
View, analyse and get alarms on all your data in Senmos — in real time, whatever the hardware.
Contact
Want to hear more about what we can offer? Contact director Kasper Myrtue or read our brochure.