Construction environmental monitoring
Keep the neighbours — and the regulator — on your side
Roadworks and building sites shake, dust and roar. Regulations set hard limits on vibration, dust and noise, precisely so nearby homes don’t crack and people aren’t harmed. Senmos watches all three live, across every neighbouring property, and raises the alarm the instant a limit is approached.
One rulebook, three limits


Compliance and protecting your neighbours are the same job. The thresholds in the regulations exist to stop nearby buildings cracking and to spare residents from harmful dust and noise — so staying under them keeps you legal and keeps the people next door safe. Senmos turns that one rulebook into live, per-property limits with automatic alarms.

“We are personally using this platform and it’s impressive what it can do, hopefully much more to come.”
Matt SuttonInfrastructure Inspections Manager, Stroma Built Environment
How a construction zone is instrumented
Picture an active construction zone with the 5–10 nearby properties around it. Every property carries the same monitoring point — vibration, dust and noise together — so you watch all three sensor types at once. Impact falls off with distance from the works, so the closest, most vulnerable buildings get the tightest limits.
Sensor-to-screen, live at every property
Triaxial vibration sensors (PPV)
Measure peak particle velocity in mm/s on or beside each building — the number that tells you whether the structure is at risk.
Dust / particulate sensors (PM10 / PM2.5)
Track airborne dust concentration in real time, so air-quality limits are met and complaints can be answered with data.
Sound-level meters (dB(A))
Continuously log noise at the property line against the permitted day/evening/night limits.
Per-property thresholds + automated alarms
Each property gets its own limits based on distance and building type, streaming live into Senmos — an alert fires the moment a limit is approached.
Why each one matters
Three simple stories, one platform. Each measurement protects something specific — and each one trips an alarm in Senmos the moment it crosses the limit.
What this looks like in Senmos
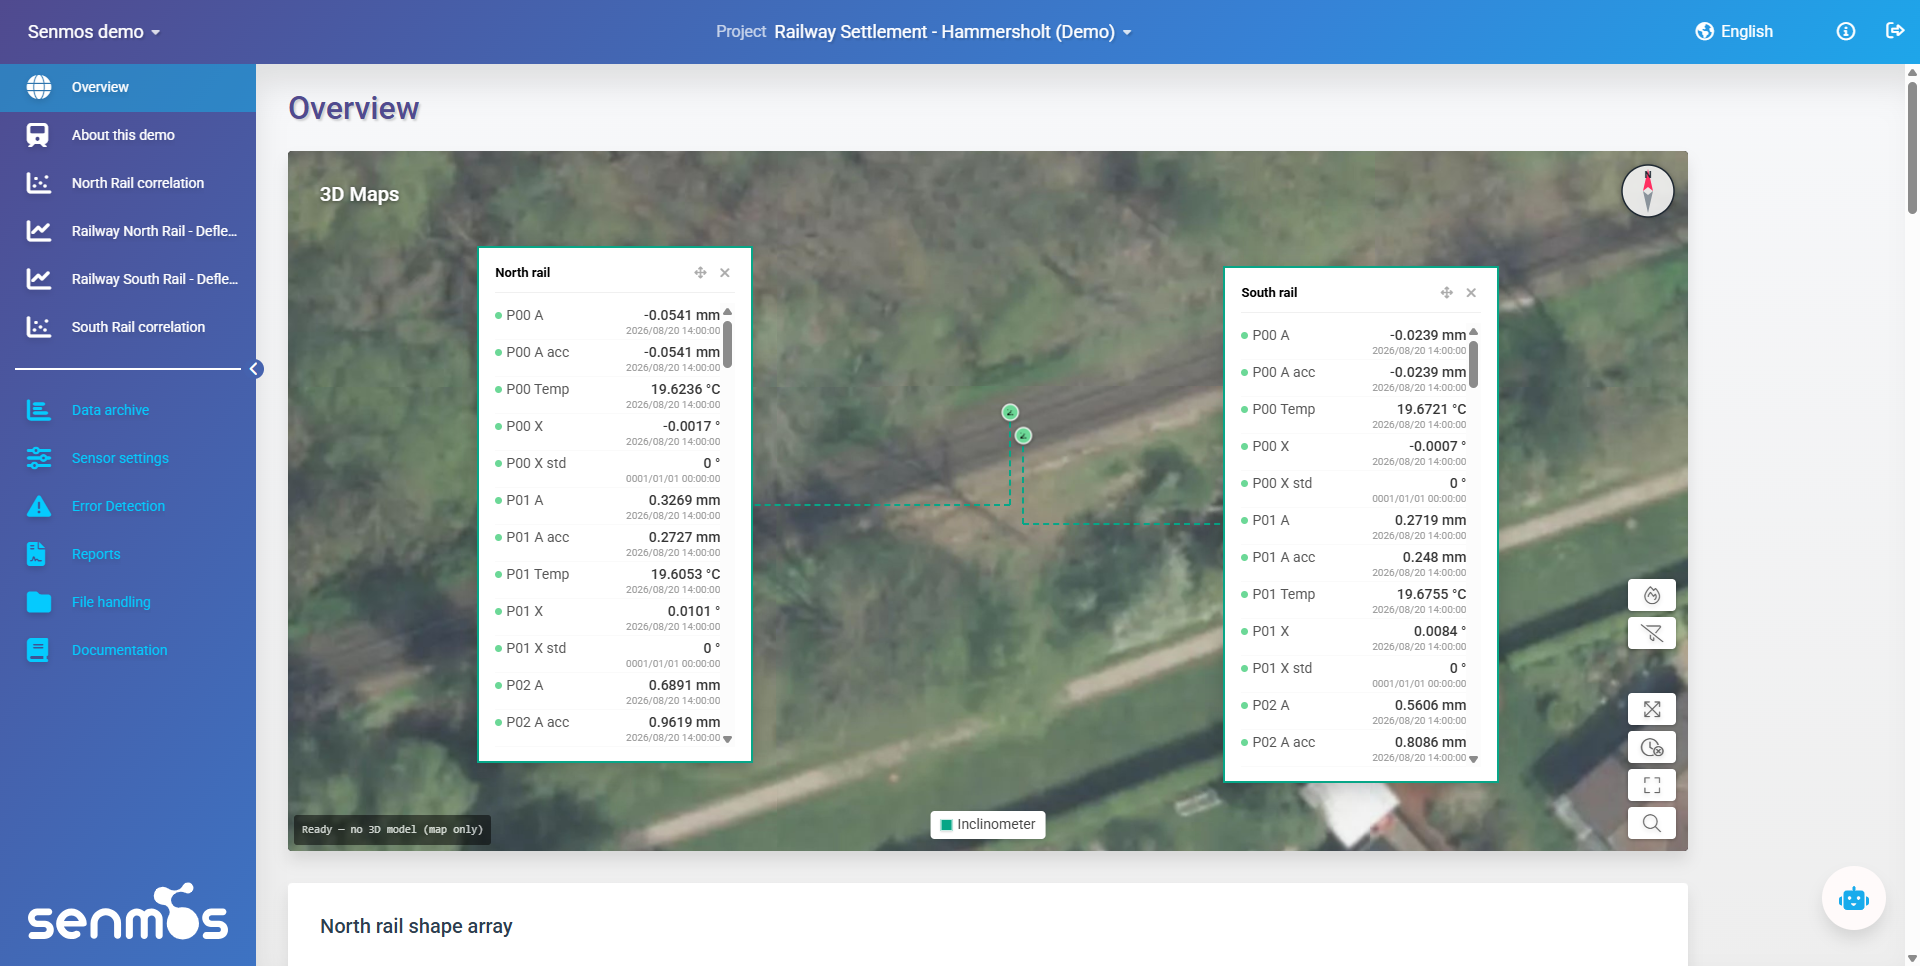
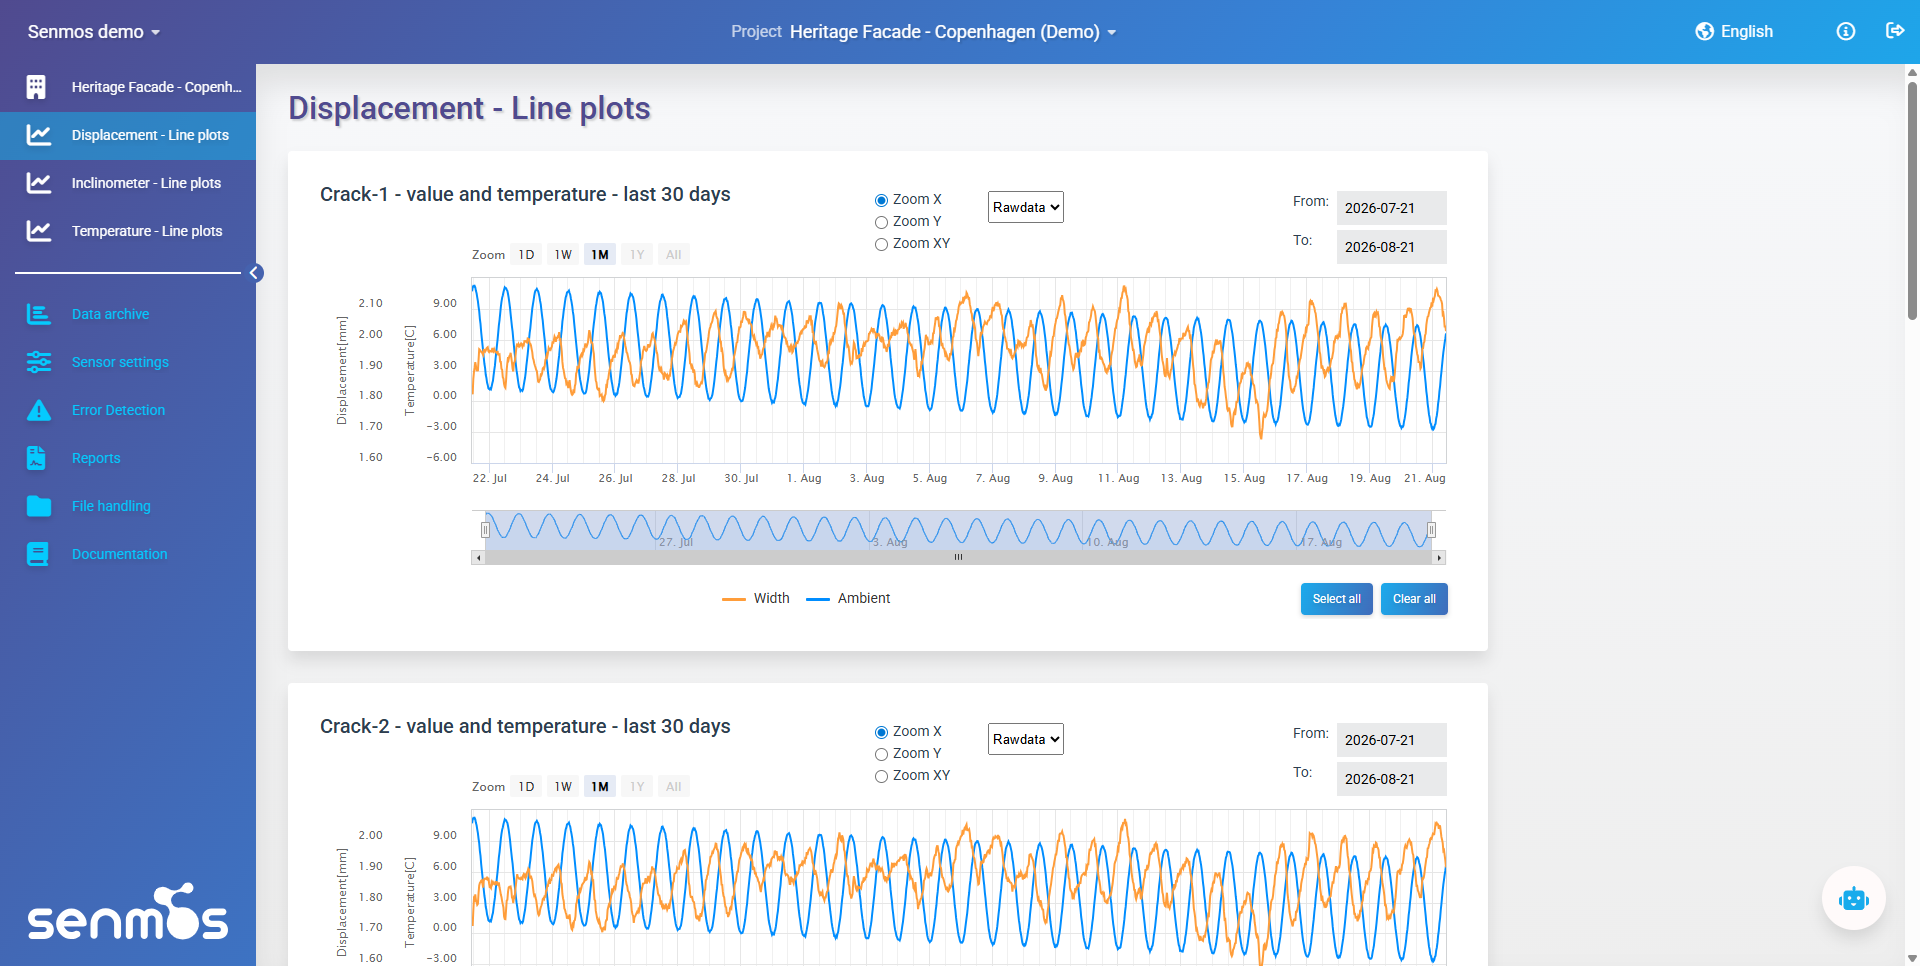
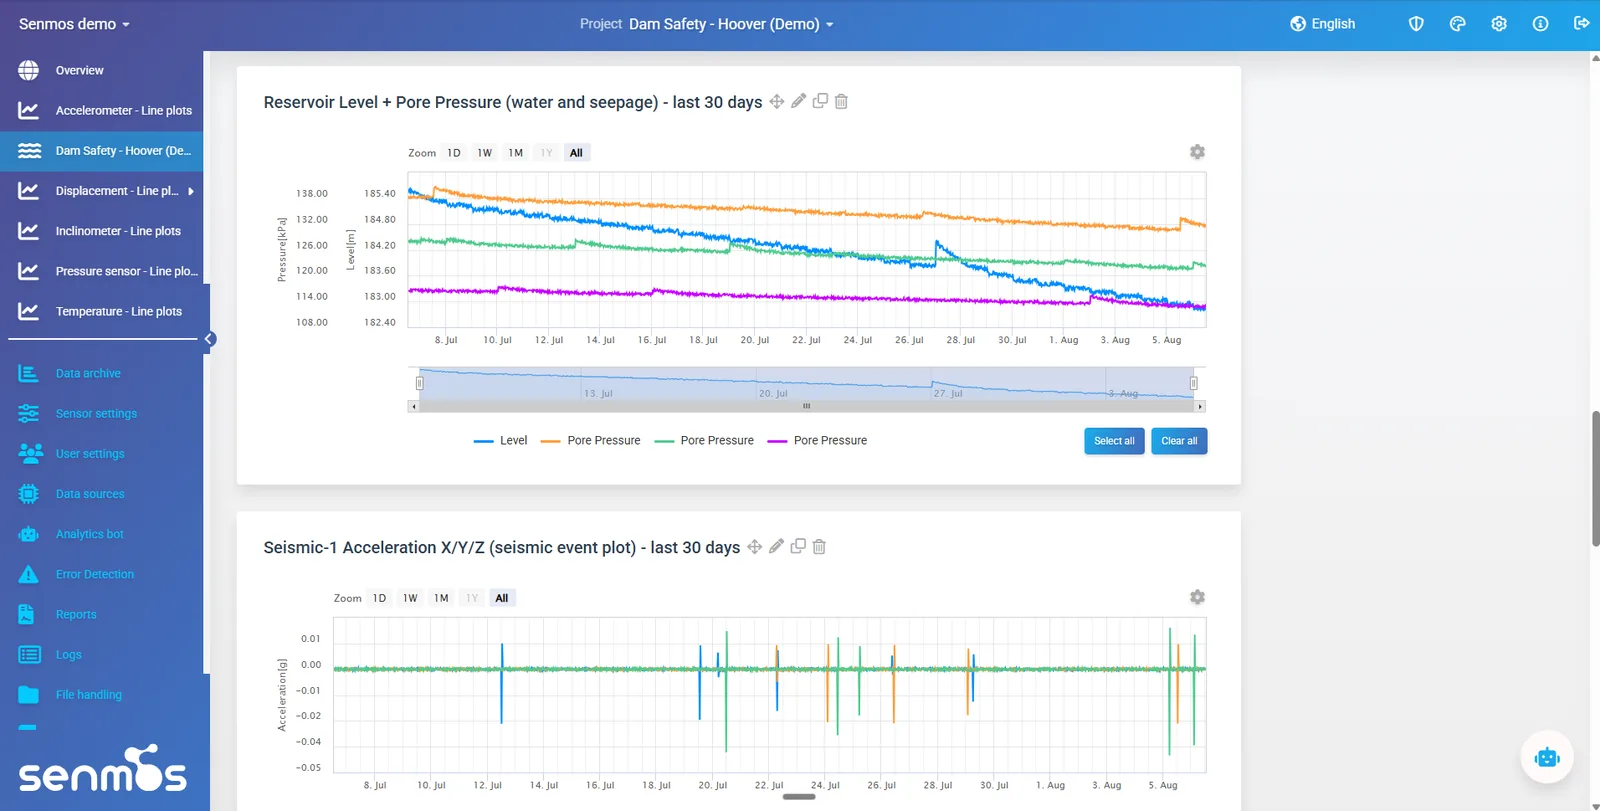
The dedicated environmental demo — vibration, dust and noise across a street of properties — is being built. The views here come from live Senmos demo projects, and the platform behaviour is the same. In Senmos you can:
See every monitored property
The street map with all 5–10 properties pinned, each showing its current vibration / dust / noise status.
Track vibration against its limit
Open one property’s PPV history and see exactly how close it has come to cracking risk.
Follow dust & noise trends
Particulate and dB(A) trends over the day, against the permitted limits.
Review the alarm log
Every threshold breach, when it happened and at which property — your audit trail for the regulator.