Railway settlement monitoring · Live demo
Drilling under a live railway — without stopping the trains
When pipes are pushed beneath an active rail line, Danish law requires continuous settlement monitoring. See exactly how it’s done — on the real Hammersholt setup — then log into a live demo and explore the data yourself.
A real job on the Copenhagen S-train network

In 2024–25, district-heating pipes were installed under S-train line A at Hammersholt near Hillerød. Trains had to keep running while the ground beneath them was disturbed — so every millimetre of track settlement was watched in real time.
Banedanmark — rail authority · LIFA — surveying & lead · Worldsensing — wireless tiltmeters · KI / Senmos — monitoring platform

“We greatly appreciate our partnership and the excellent collaboration with KI. Using Senmos is simple, and our clients have expressed great satisfaction with the visualizations on the platform.”
Jakob LarsenLand surveyor and Partner at LIFA
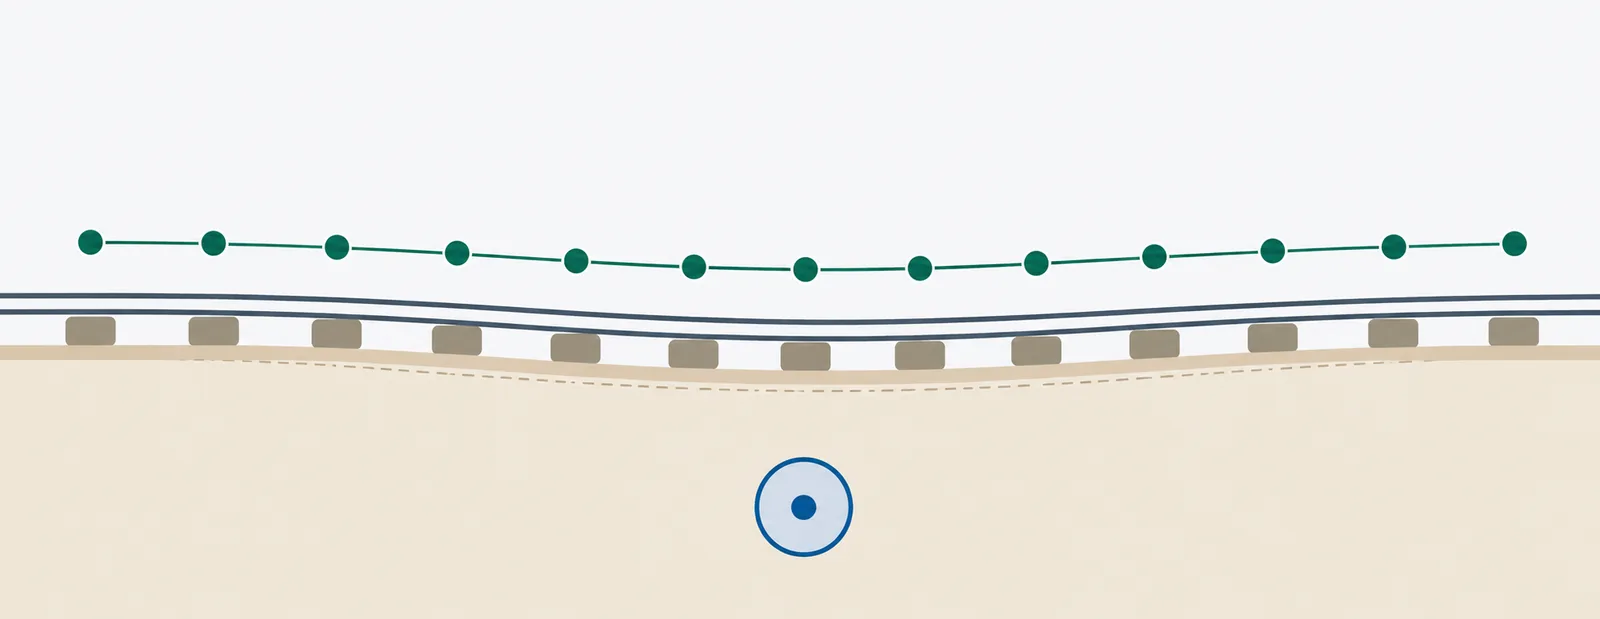
How the track is instrumented
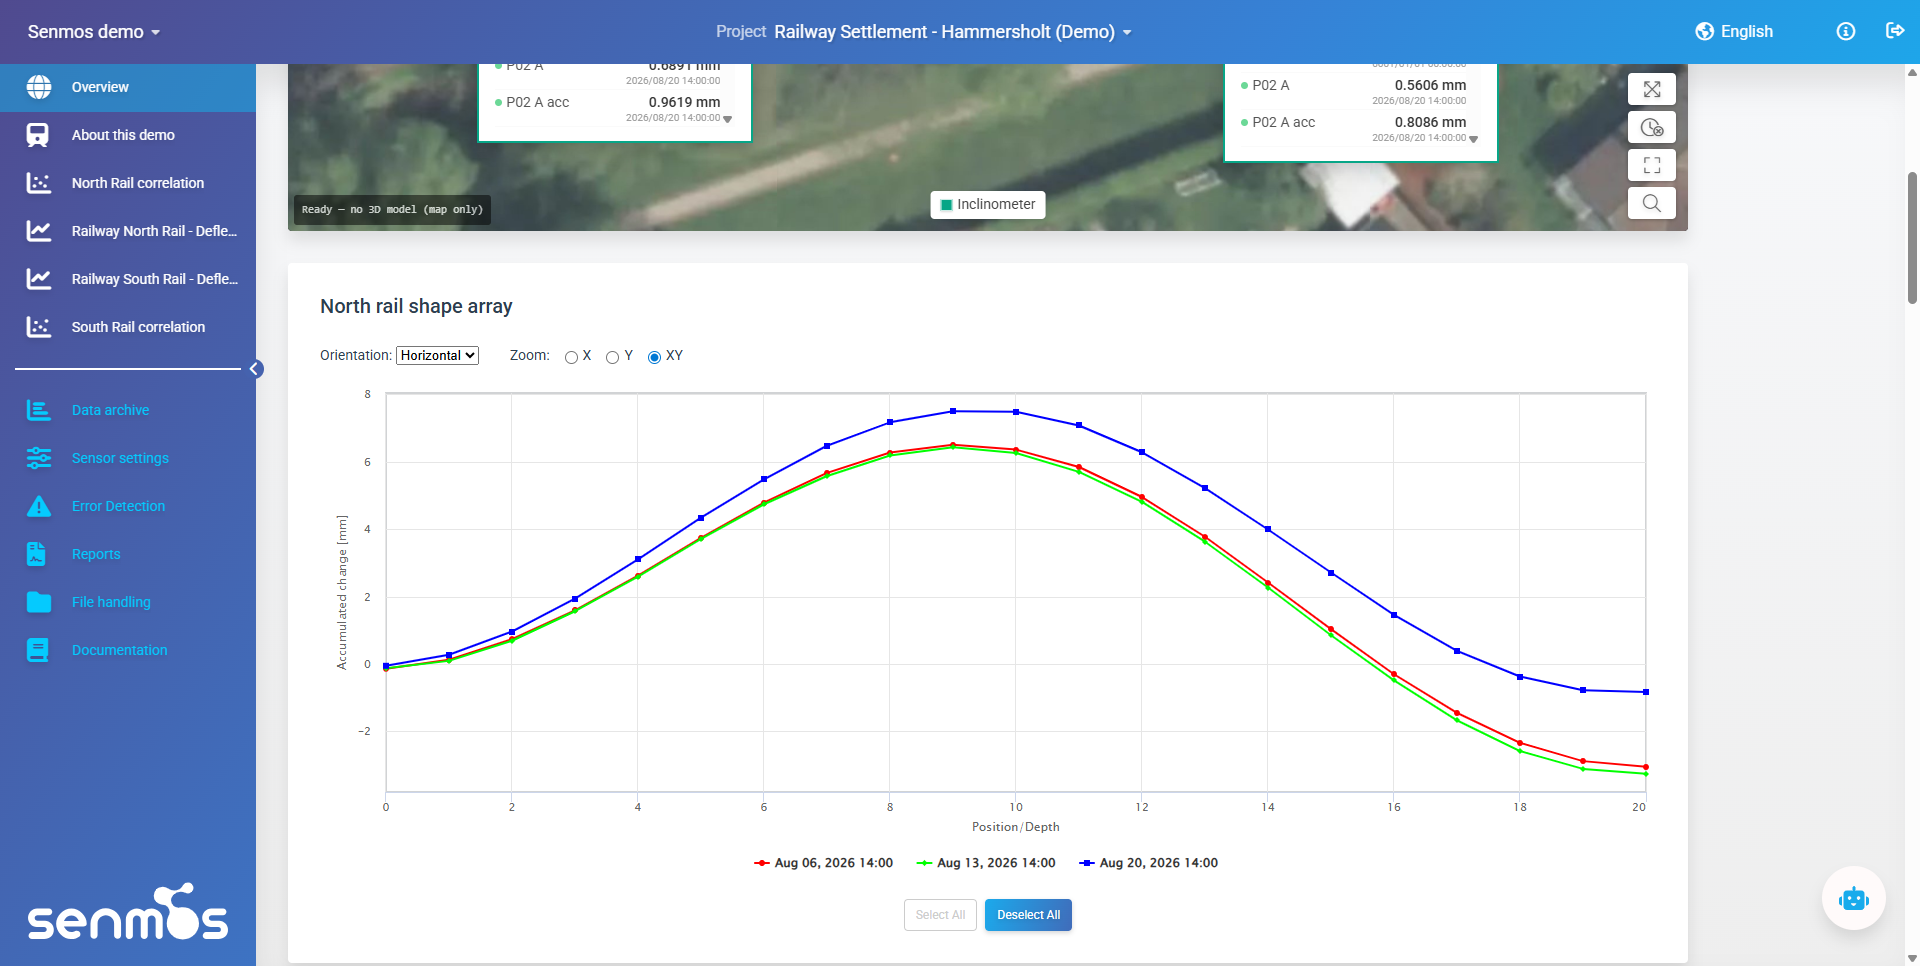
54 Worldsensing tiltmeters sit on aluminium beams fixed between every third sleeper, forming a continuous shape array along each rail. As pipes are pushed under the track, a settlement trough forms — and the array draws its exact shape. The beams span between sleepers, so each inclinometer measures the tilt of a short length of track. Chain them together and the array reads the shape of the settlement, not just its depth at one point.
Section — Pipes pushed under the track create a settlement trough; the tiltmeter shape array along each rail captures its exact shape.
Sensor-to-screen, every 30 seconds
LIFA aluminium beams
Purpose-built ~1.8 m beams hold one tiltmeter each and clamp across the track — turning point sensors into a continuous array.
Worldsensing tiltmeters
54 wireless tiltmeters measuring track tilt and internal temperature.
Worldsensing MQTT → Senmos
Live readings stream straight into Senmos over Worldsensing’s cloud MQTT — every 30 s, no manual import.
Automated alarms
Predefined thresholds trigger alerts the moment a genuine settlement trend appears.
The tiltmeters at Hammersholt are Worldsensing, but nothing about the method is tied to one vendor — Senmos is hardware-agnostic, and the same shape array can be built from whatever suits the job. In-place inclinometer (IPI) strings from Sisgeo or Geosense, wireless inclinometer arrays from Ackcio, Senceive or Move Solutions, tilt sensors from Level Developments, or high-rate acquisition from Dewesoft — all feed the same processing chain and the same alarms.
The hard part Senmos does for you
Raw tilt on a 1.8 m aluminium beam under a moving train is buried in temperature drift and vibration. Here’s what Senmos does to each inclinometer’s signal — and how the clean live values become a shape array.
See it live in Senmos
The demo is a fully working Senmos project on the real Hammersholt location — with simulated data so you can explore freely. Log in and you can:
Watch the shape arrays
Both rails’ deflected profiles updating live as the trough develops.
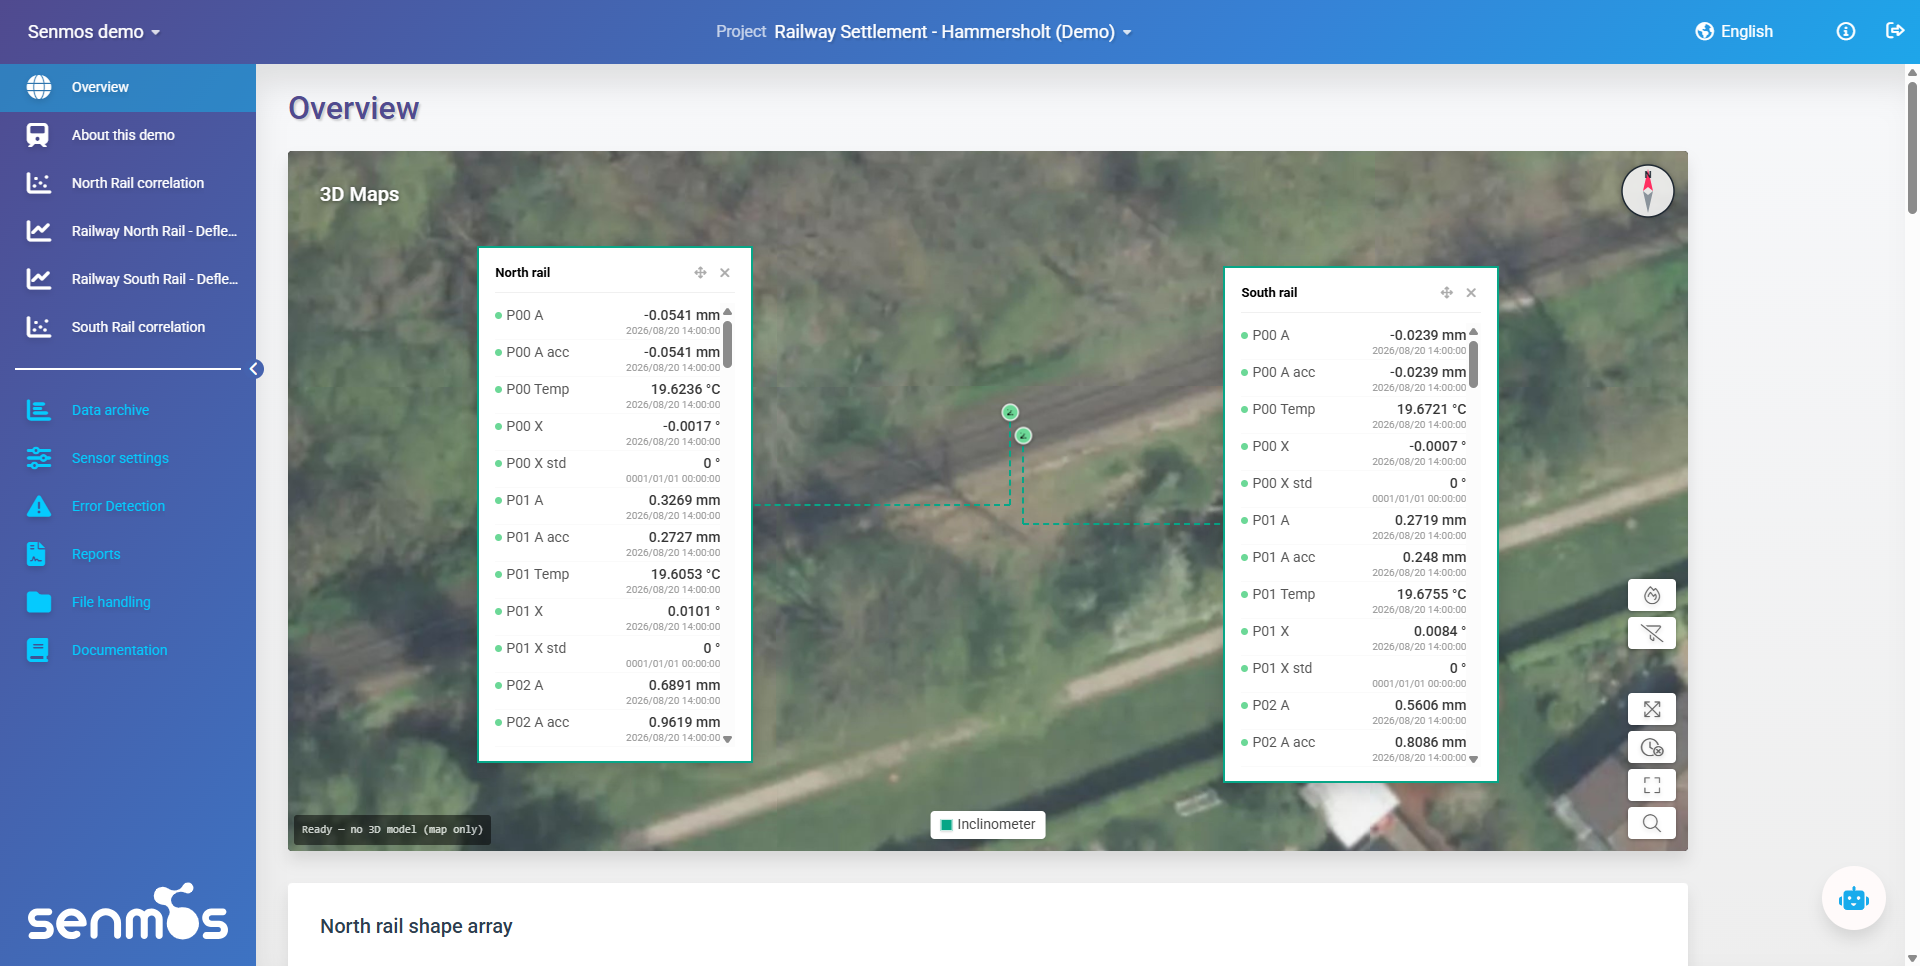
Explore in 3D
The track on a 3D map, sensors pinned where they really sit.
Dig into one sensor
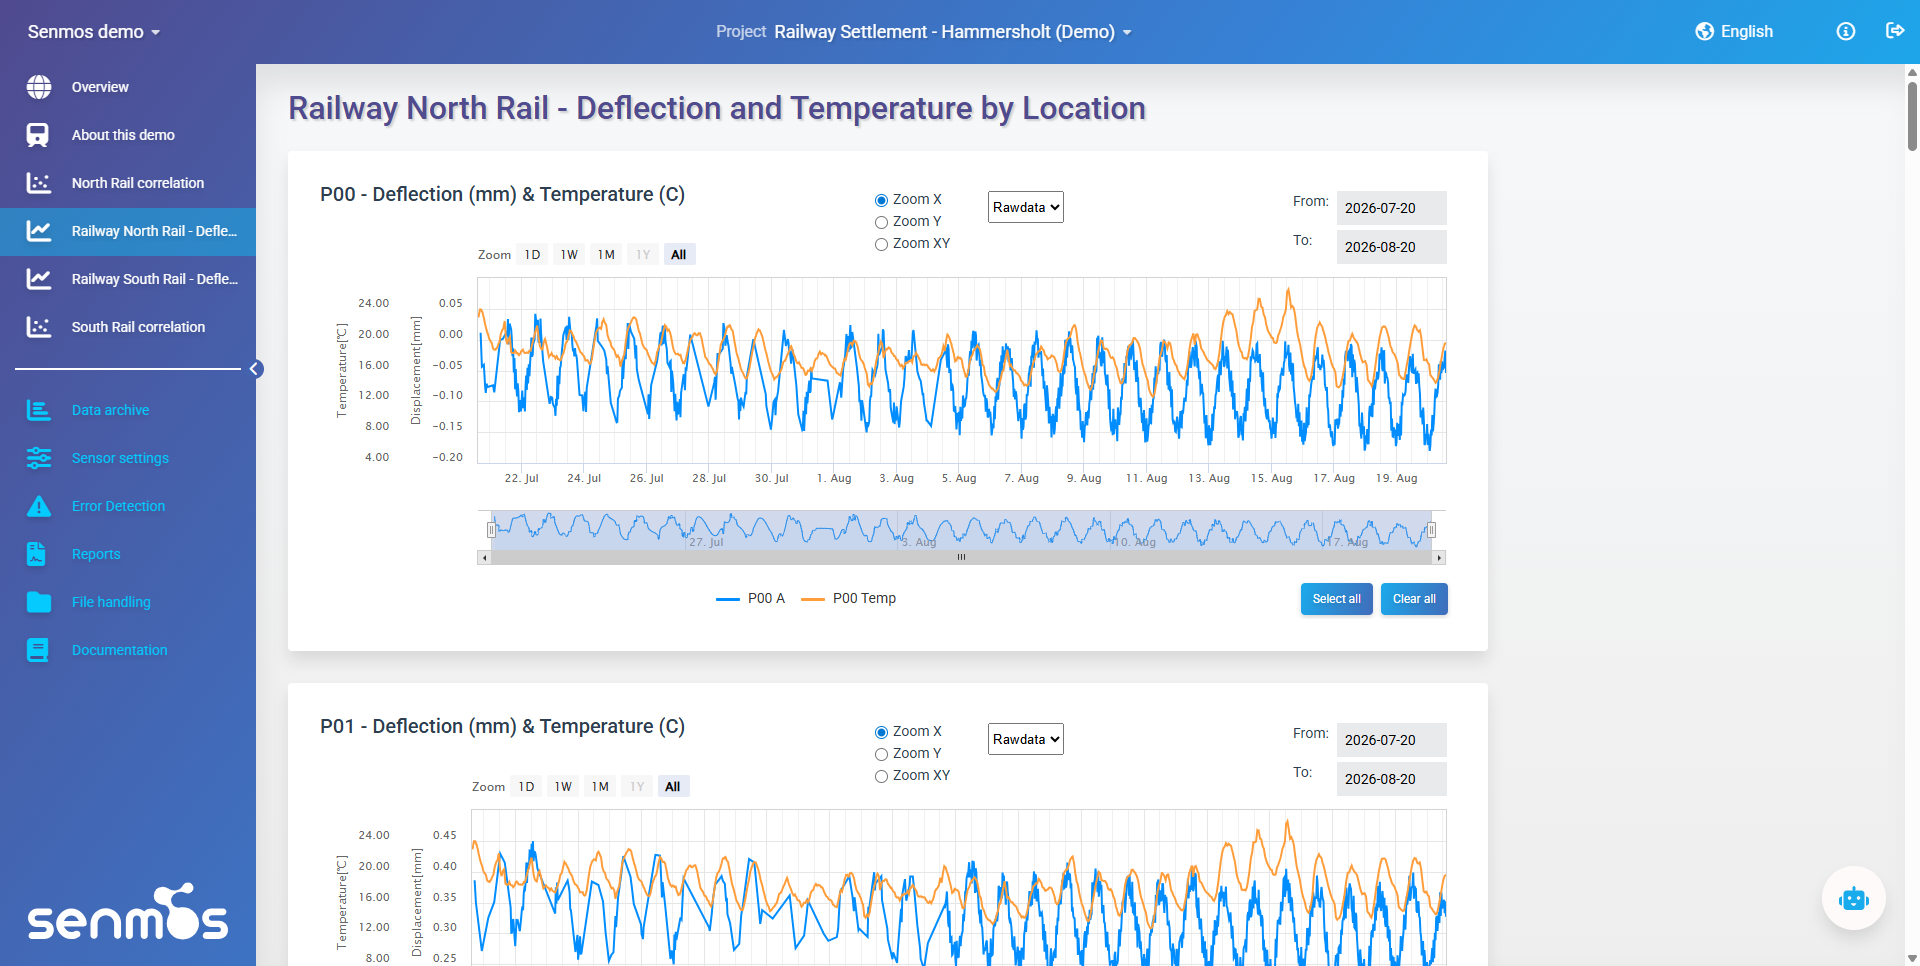
Open any tiltmeter’s full history.
See the calculations
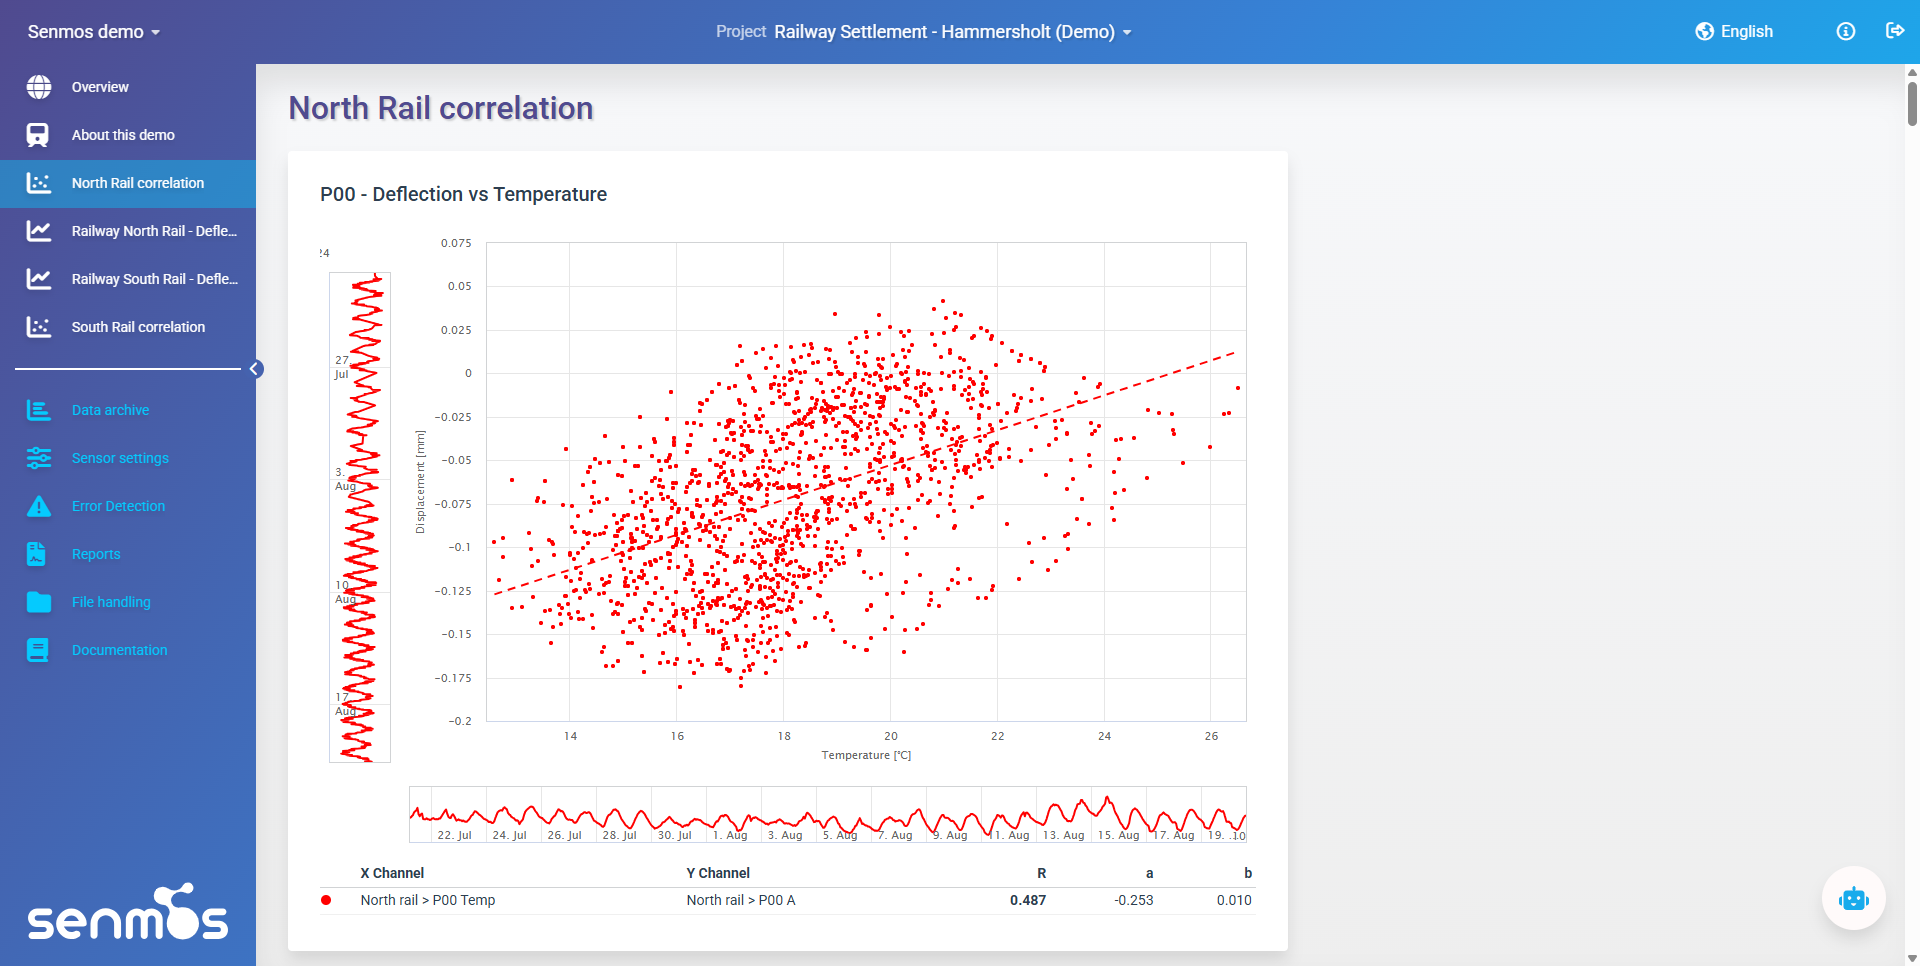
Inspect the virtual channels — differential settlement, % of limit.