Dam safety monitoring · Live demo
Telling real dam movement from the daily rise and fall
Every dam breathes. It leans as the reservoir fills and drains, and it expands and contracts with the sun and the seasons. That constant, harmless motion hides the movement that actually signals danger. Senmos uses correlation analysis and virtual sensor channels to strip out the water-level and temperature effects — so alarms fire on genuine structural change, not on the daily tide.
What actually matters for dam safety

A dam fails through a small number of well-understood mechanisms: seepage and rising pore pressure in the body or foundation, settlement and deformation of the embankment or structure, and displacement of the crest. The thing that drives almost all of the normal day-to-day movement is the reservoir water level — followed by temperature. Read raw, those drivers swamp the safety signal. Model them out, and the real story is left standing alone.

“We have been very happy with Senmos, it has been a welcome change onto a more modern and cheaper solution after working with Vista Data Vision in the past.”
Remigijus AbromavičiusCEO, GPS partneris — geotechnical monitoring
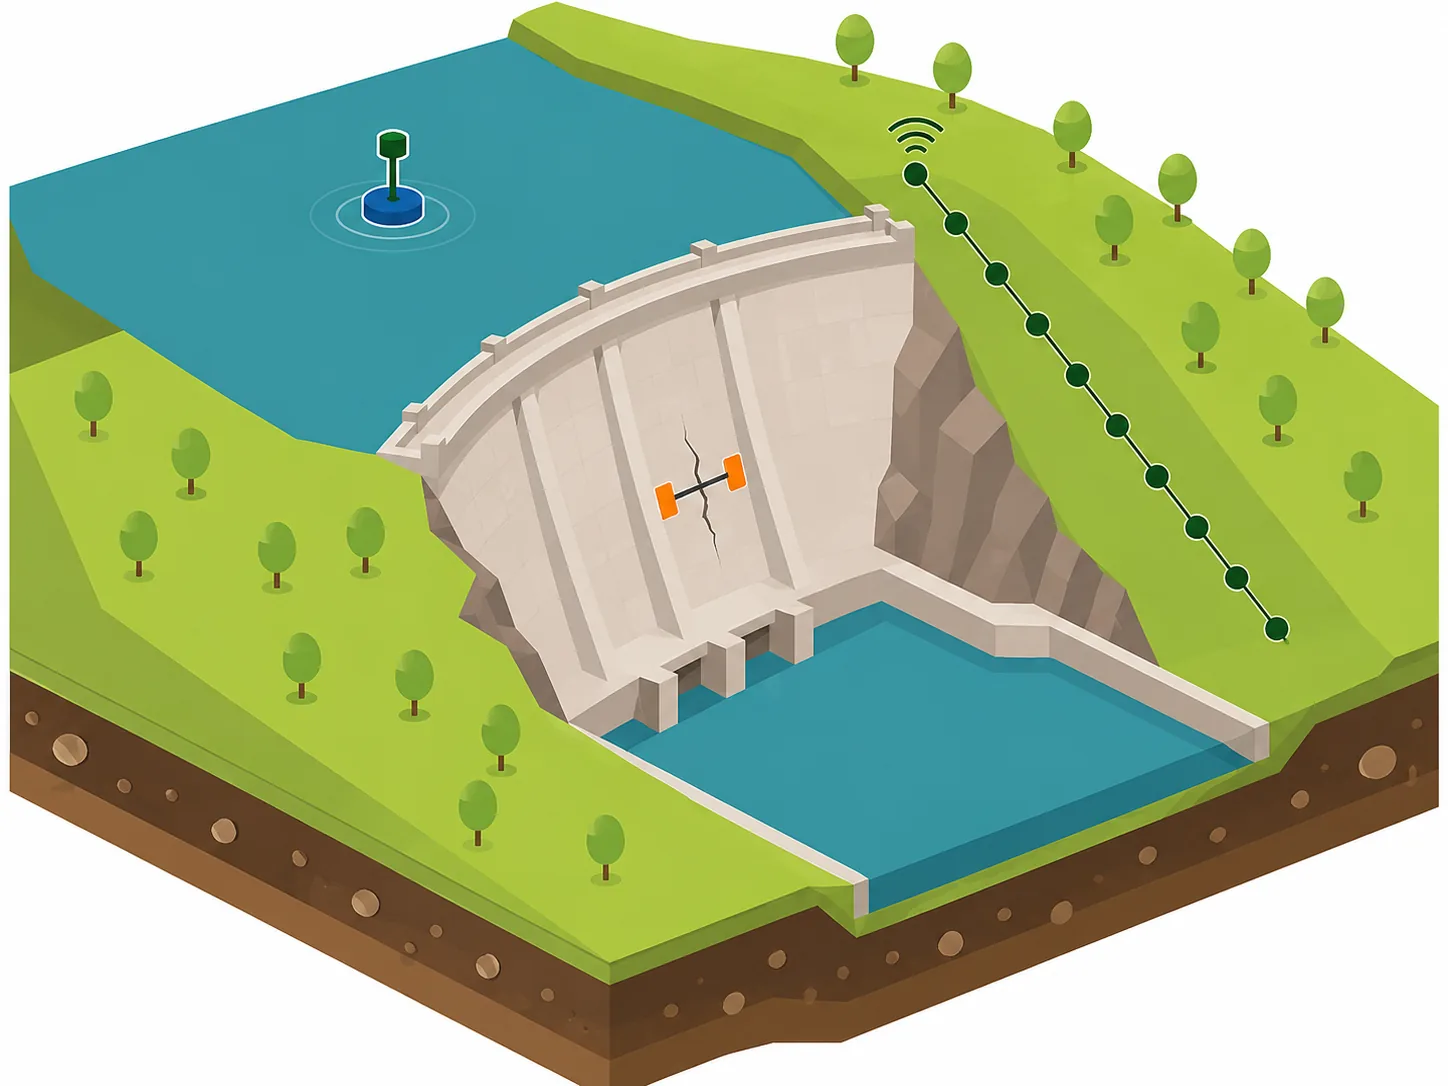
How a dam is instrumented
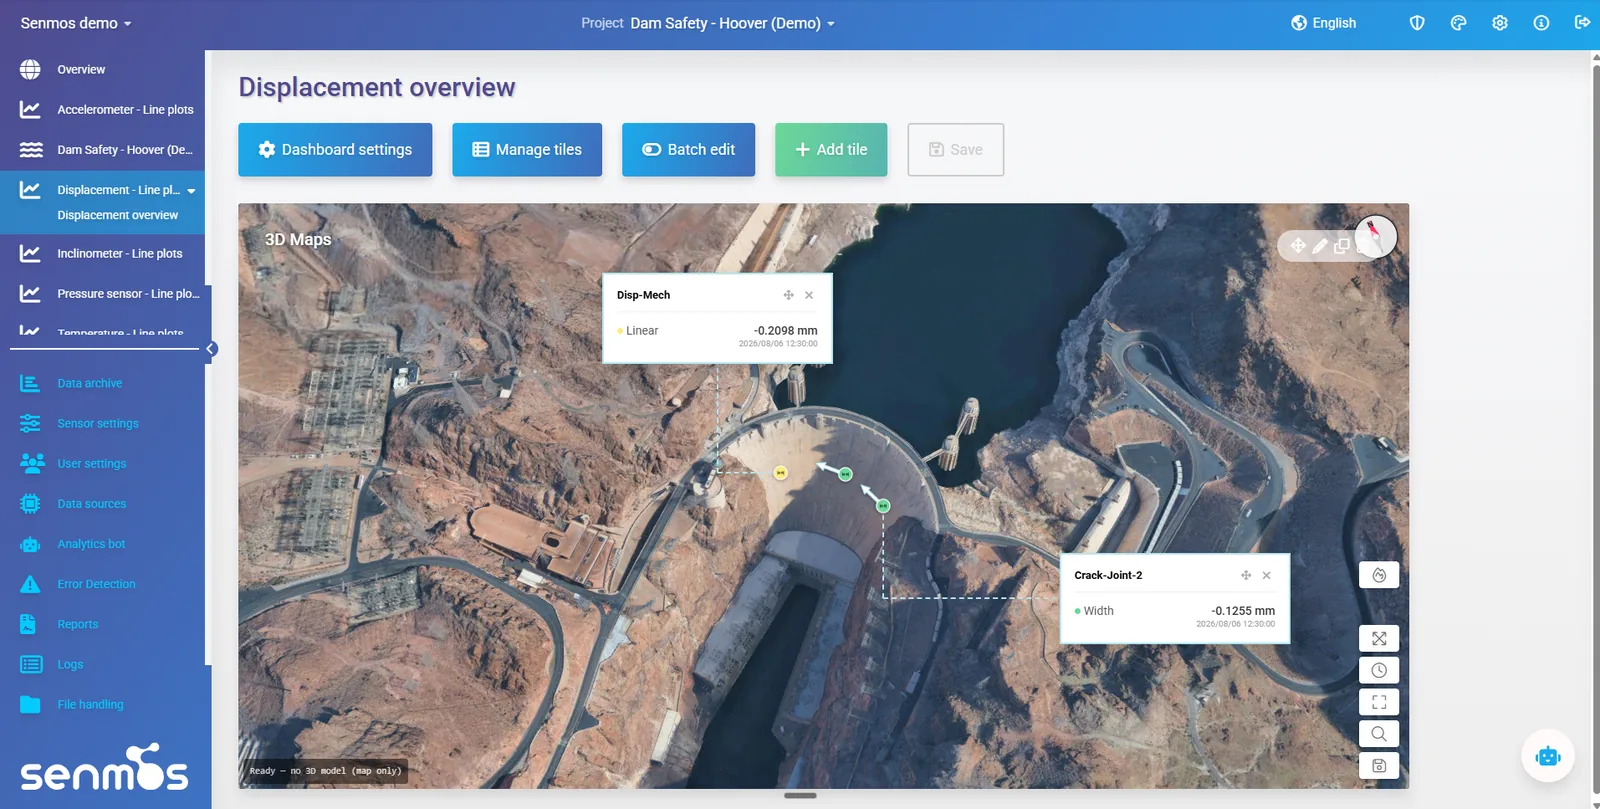
Sensors are placed where the failure mechanisms show themselves: in the body and slope to catch deformation, on the joints to catch cracking, and on the crest to catch displacement. The reservoir level gauge matters just as much — it is the signal everything else is correlated against.
Each instrument answers a different failure question — the slope string for deformation, the crack meter for joint movement, the level gauge for the driver everything else is measured against.
From a noisy sensor mix to a single safety signal
The full sensor mix into Senmos
Inclinometers/IPI strings, crack meters, GNSS/GPS, piezometers and the reservoir-level gauge stream into one Senmos project — automatic ingest, no manual import.
Correlation analysis
Senmos quantifies how strongly each safety signal tracks the reservoir level and temperature — identifying the drivers and how much of the daily movement they explain.
Virtual sensor channels
A calculated channel models the expected movement from water level & temperature, then subtracts it: residual = measured − modelled. What’s left is the movement those drivers can’t explain.
Automated alarms on the residual
Thresholds sit on the clean residual, not the raw signal — so an alarm means genuine structural change, not a full reservoir on a hot afternoon.
The intelligence layer — what makes the alarm trustworthy
Crack, GPS and displacement signals correlate with both water level and temperature at the same time — so plotted against either one alone, the scatter is wide and far from linear (medium correlation). Senmos models the temperature out and re-tests movement against water level: the cloud collapses onto a tight, straight line (high correlation). That clean relationship is what the alarm is built on.
See it live in Senmos
The demo is a fully working Senmos dam project with simulated data, so you can explore freely. Log in and you can:
Explore the dam in 3D
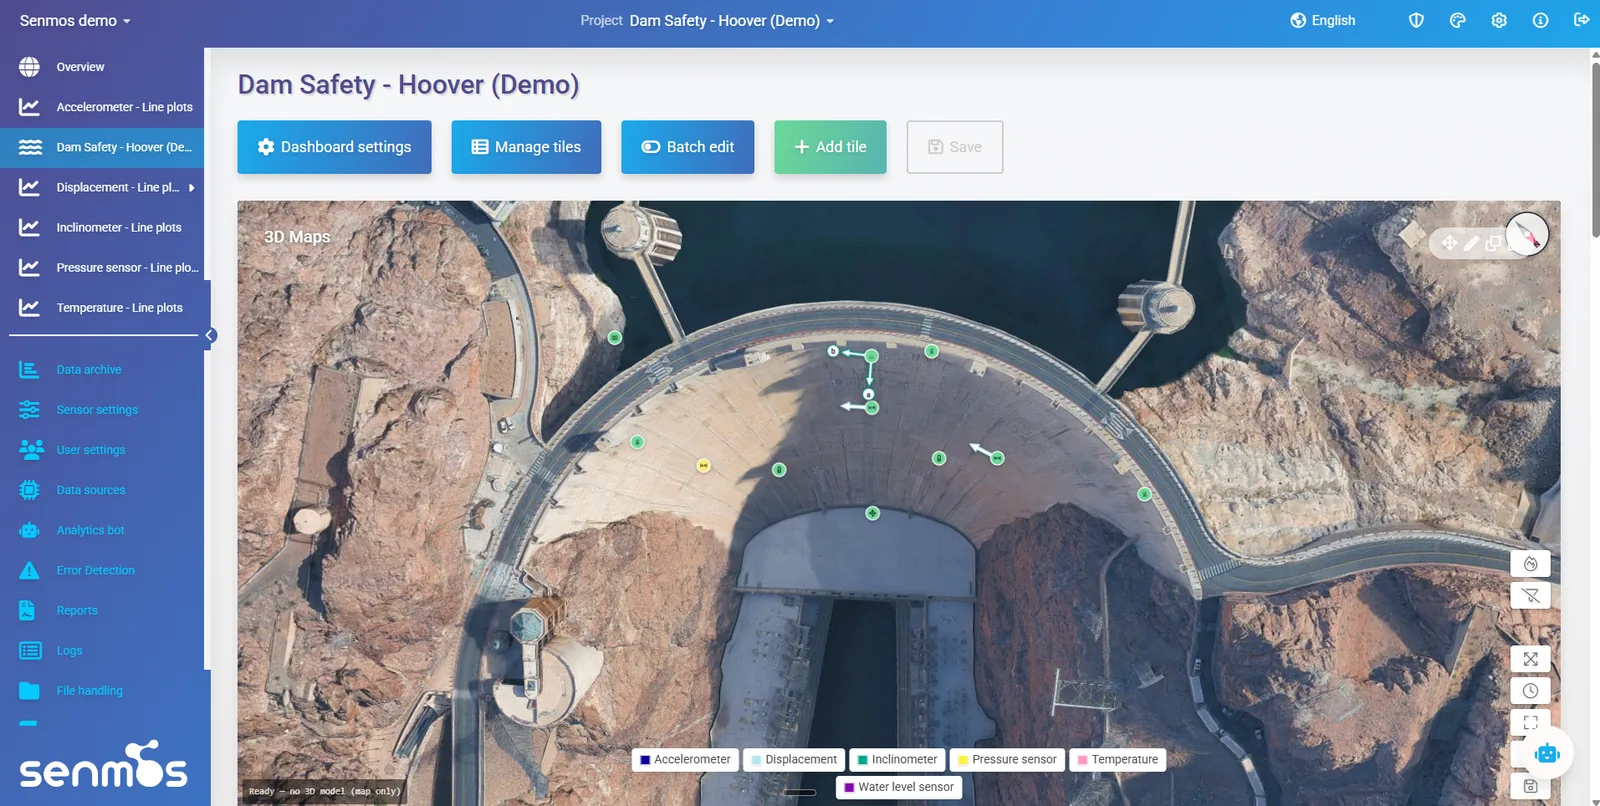
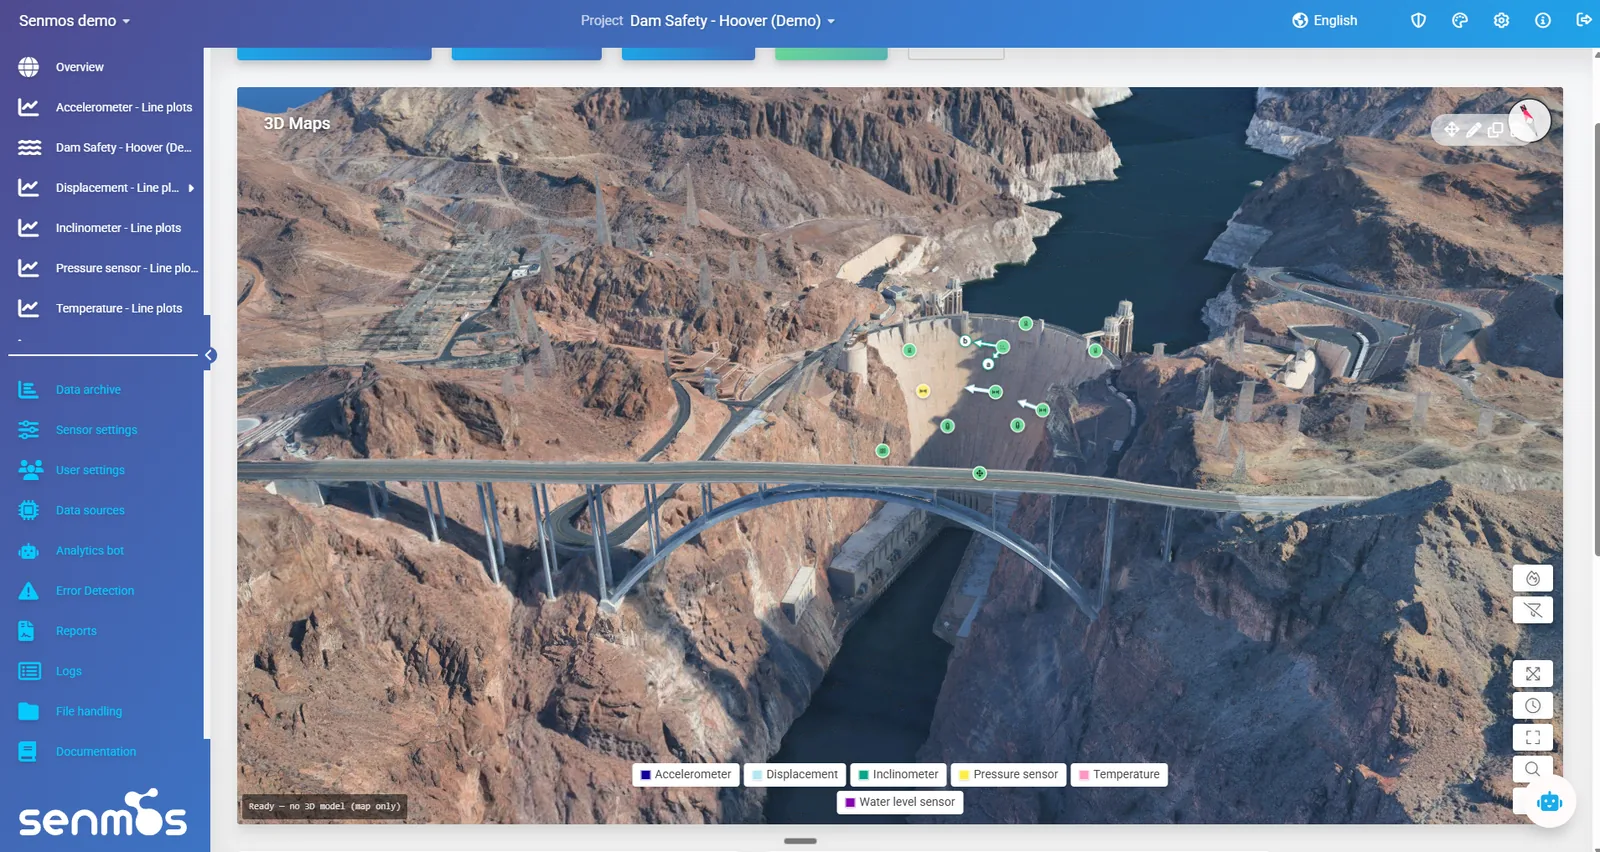
The dam model with every inclinometer, crack meter, GNSS unit and piezometer pinned where it sits.
Watch the slope deform
The IPI string and slope-monitoring view showing body and downstream-face movement.
Compare measured vs residual
The correlation/residual chart — raw signal, modelled effect, and the clean residual side by side.
Trace seepage & cracks
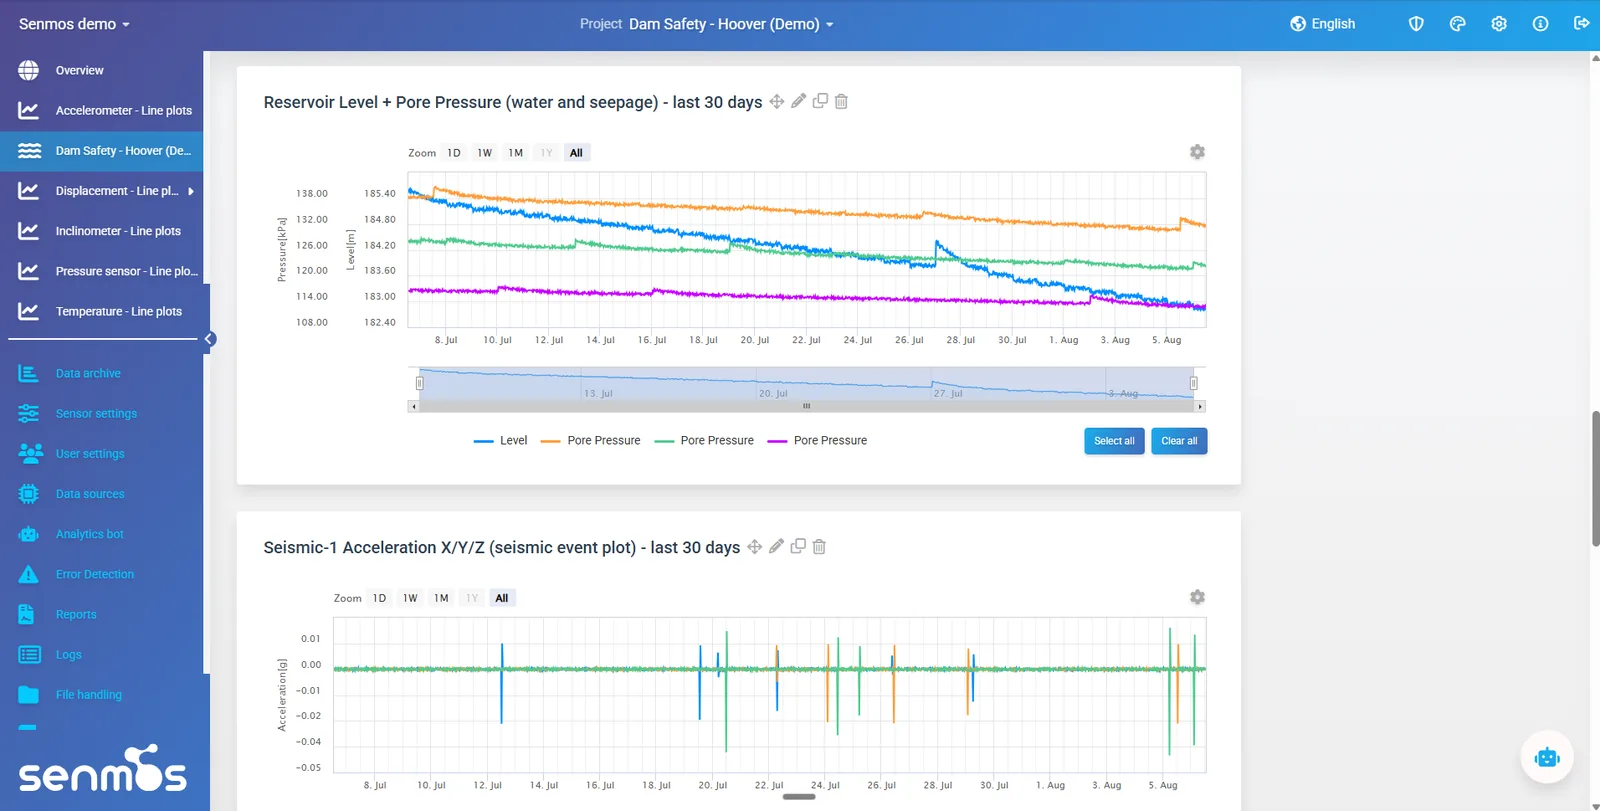
Crack-meter and piezometer history, with the reservoir-level overlay that drives them.